
NetSuite is excellent at recording transactions. Every item receipt, every vendor bill, every invoice—captured in detail with full audit trails.
But ask NetSuite a simple question like "Which receipts are still unbilled?" or "What was the actual cost of goods sold on this sales order?" and you'll find a gap. The transactions exist, but the connections between them don't.
This is the problem Stock-Billing Links was built to solve.
The Missing Links
Every business that buys and sells stock has the same fundamental reporting needs. They need to understand the relationship between physical stock movements and the financial transactions that go with them:

NetSuite's "Match Bill to Receipt" feature creates document-level references, but it doesn't allocate specific quantities and values. When a purchase order has multiple receipts and multiple bills arriving over weeks or months, the connections disappear into aggregated totals.
The Real Cost of Missing Links
Without explicit stock-billing links, finance teams resort to workarounds:
- Manual reconciliations — Spreadsheets mapping receipts to bills, updated monthly (or ignored)
- Complex saved searches — Fragile queries that aggregate by PO and item, breaking when multiple lines share the same item
- Estimated margins — Using average costs instead of actual FIFO costs, hiding true profitability
- Unexplained variances — Cost of sale adjustments that no one can trace to source transactions
The month-end question: "What's in our GRNI account?" shouldn't require two days of spreadsheet work. But for many NetSuite users, it does.
How Stock-Billing Links Works
Stock-Billing Links (SBL) creates what NetSuite doesn't: explicit, auditable connections between stock movements and billing transactions.
As transactions are processed, SBL creates allocation records for each line:
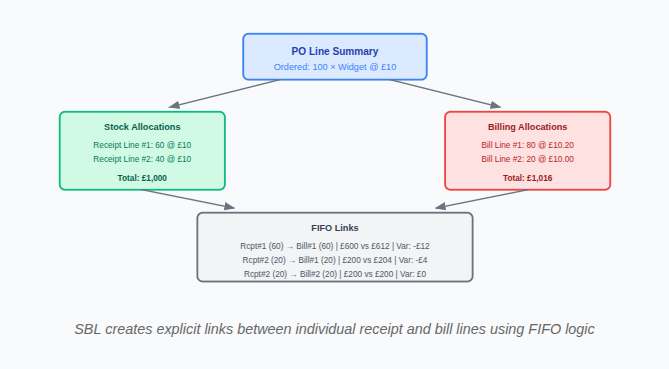
Each link record captures:
- The specific stock allocation (which receipt line)
- The specific billing allocation (which bill line)
- The quantity allocated between them
- The stock value and billing value
- The variance (price difference)
- Currency and exchange rate details
This isn't aggregation at query time—it's allocation at transaction time. The links exist as permanent, auditable records.
What This Enables
GRNI Reconciliation: Query the unlinked stock allocations. The answer is precise: these specific receipt lines, totalling this exact value, with drill-down to the source transactions.
True Profit Margins: Instead of using average inventory costs, calculate gross profit using the actual FIFO cost from linked receipts. Know which orders really made money.
Variance Analysis: Every price variance traces to a specific receipt-bill pair. No more unexplained cost of sale adjustments.
Audit Confidence: The reconciliation runs automatically—links to allocations, allocations to summaries, summaries to the general ledger. Any discrepancy surfaces immediately.
Beyond GRNI
GRNI reporting is where most businesses feel the pain first. But the same missing-link problem affects the entire stock-to-cash cycle:
| Report | Without Links | With SBL |
|---|---|---|
| GRNI Balance | Aggregated estimate by PO/item | Exact unlinked receipt lines |
| GRNC Balance | Often not tracked at all | Unlinked vendor return fulfillments |
| Gross Profit by SO | Average cost approximation | Actual FIFO cost from receipts |
| Return Cost Analysis | Manual calculation | Linked receipt-to-credit values |
| Price Variance | Account total only | Per-link breakdown by receipt/bill |
Built for NetSuite
Stock-Billing Links is built entirely within NetSuite using SuiteScript 2.1. No external systems, no data exports, no integration complexity.
- Uses NetSuite's native security and permissions
- Works with existing workflows
- Supports OneWorld and multi-subsidiary
- Handles multi-currency with exchange rate tracking
- Processes automatically as transactions are created